Given the sequences of two proteins, can a model predict which surfaces of the two chains will come together?
On the protein–protein task in FoldBench, Scinetics' AtomLM-9b achieved a 75.01% success rate, exceeding the published AlphaFold 3 result of 72.93% by 2.08 percentage points.
AtomLM-9b is built on Qwen3.5-9B. Given the sequences of two chains, it generates one structural token for each residue, one after another, much like continuing a passage of text. The challenge is that residues far apart in sequence may end up close together after folding. A residue from another chain may also fit into that same region. How can these spatial contacts be encoded in tokens?
01How can a residue be written as a single symbol?
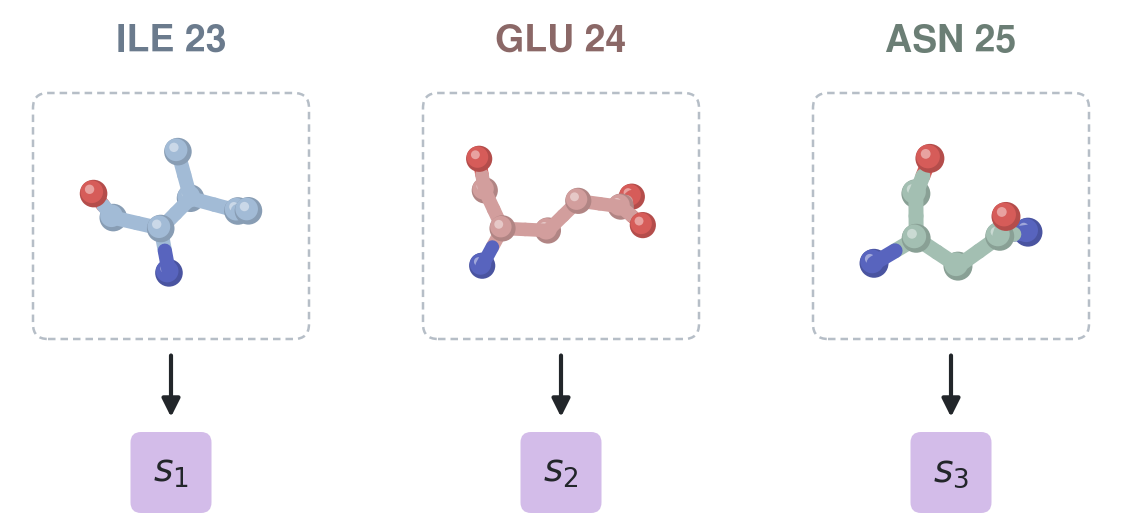
Consider three consecutive residues in ubiquitin: isoleucine at position 23, glutamate at position 24, and asparagine at position 25. In sequence form, they need only three letters: I, E, and N. We likewise assign each residue a structural token, but this identifier records geometric information. The same amino acid may receive a different identifier when its side chain points in a different direction or when an additional ligand is nearby.
During tokenizer training, the encoder sees the entire complex. For an atom at an interface, its neighbors include both atoms to which it is bonded and nearby atoms from another chain. The encoder first passes information among these neighbors, then aggregates it at the residue level. This allows a residue representation to capture its binding environment.
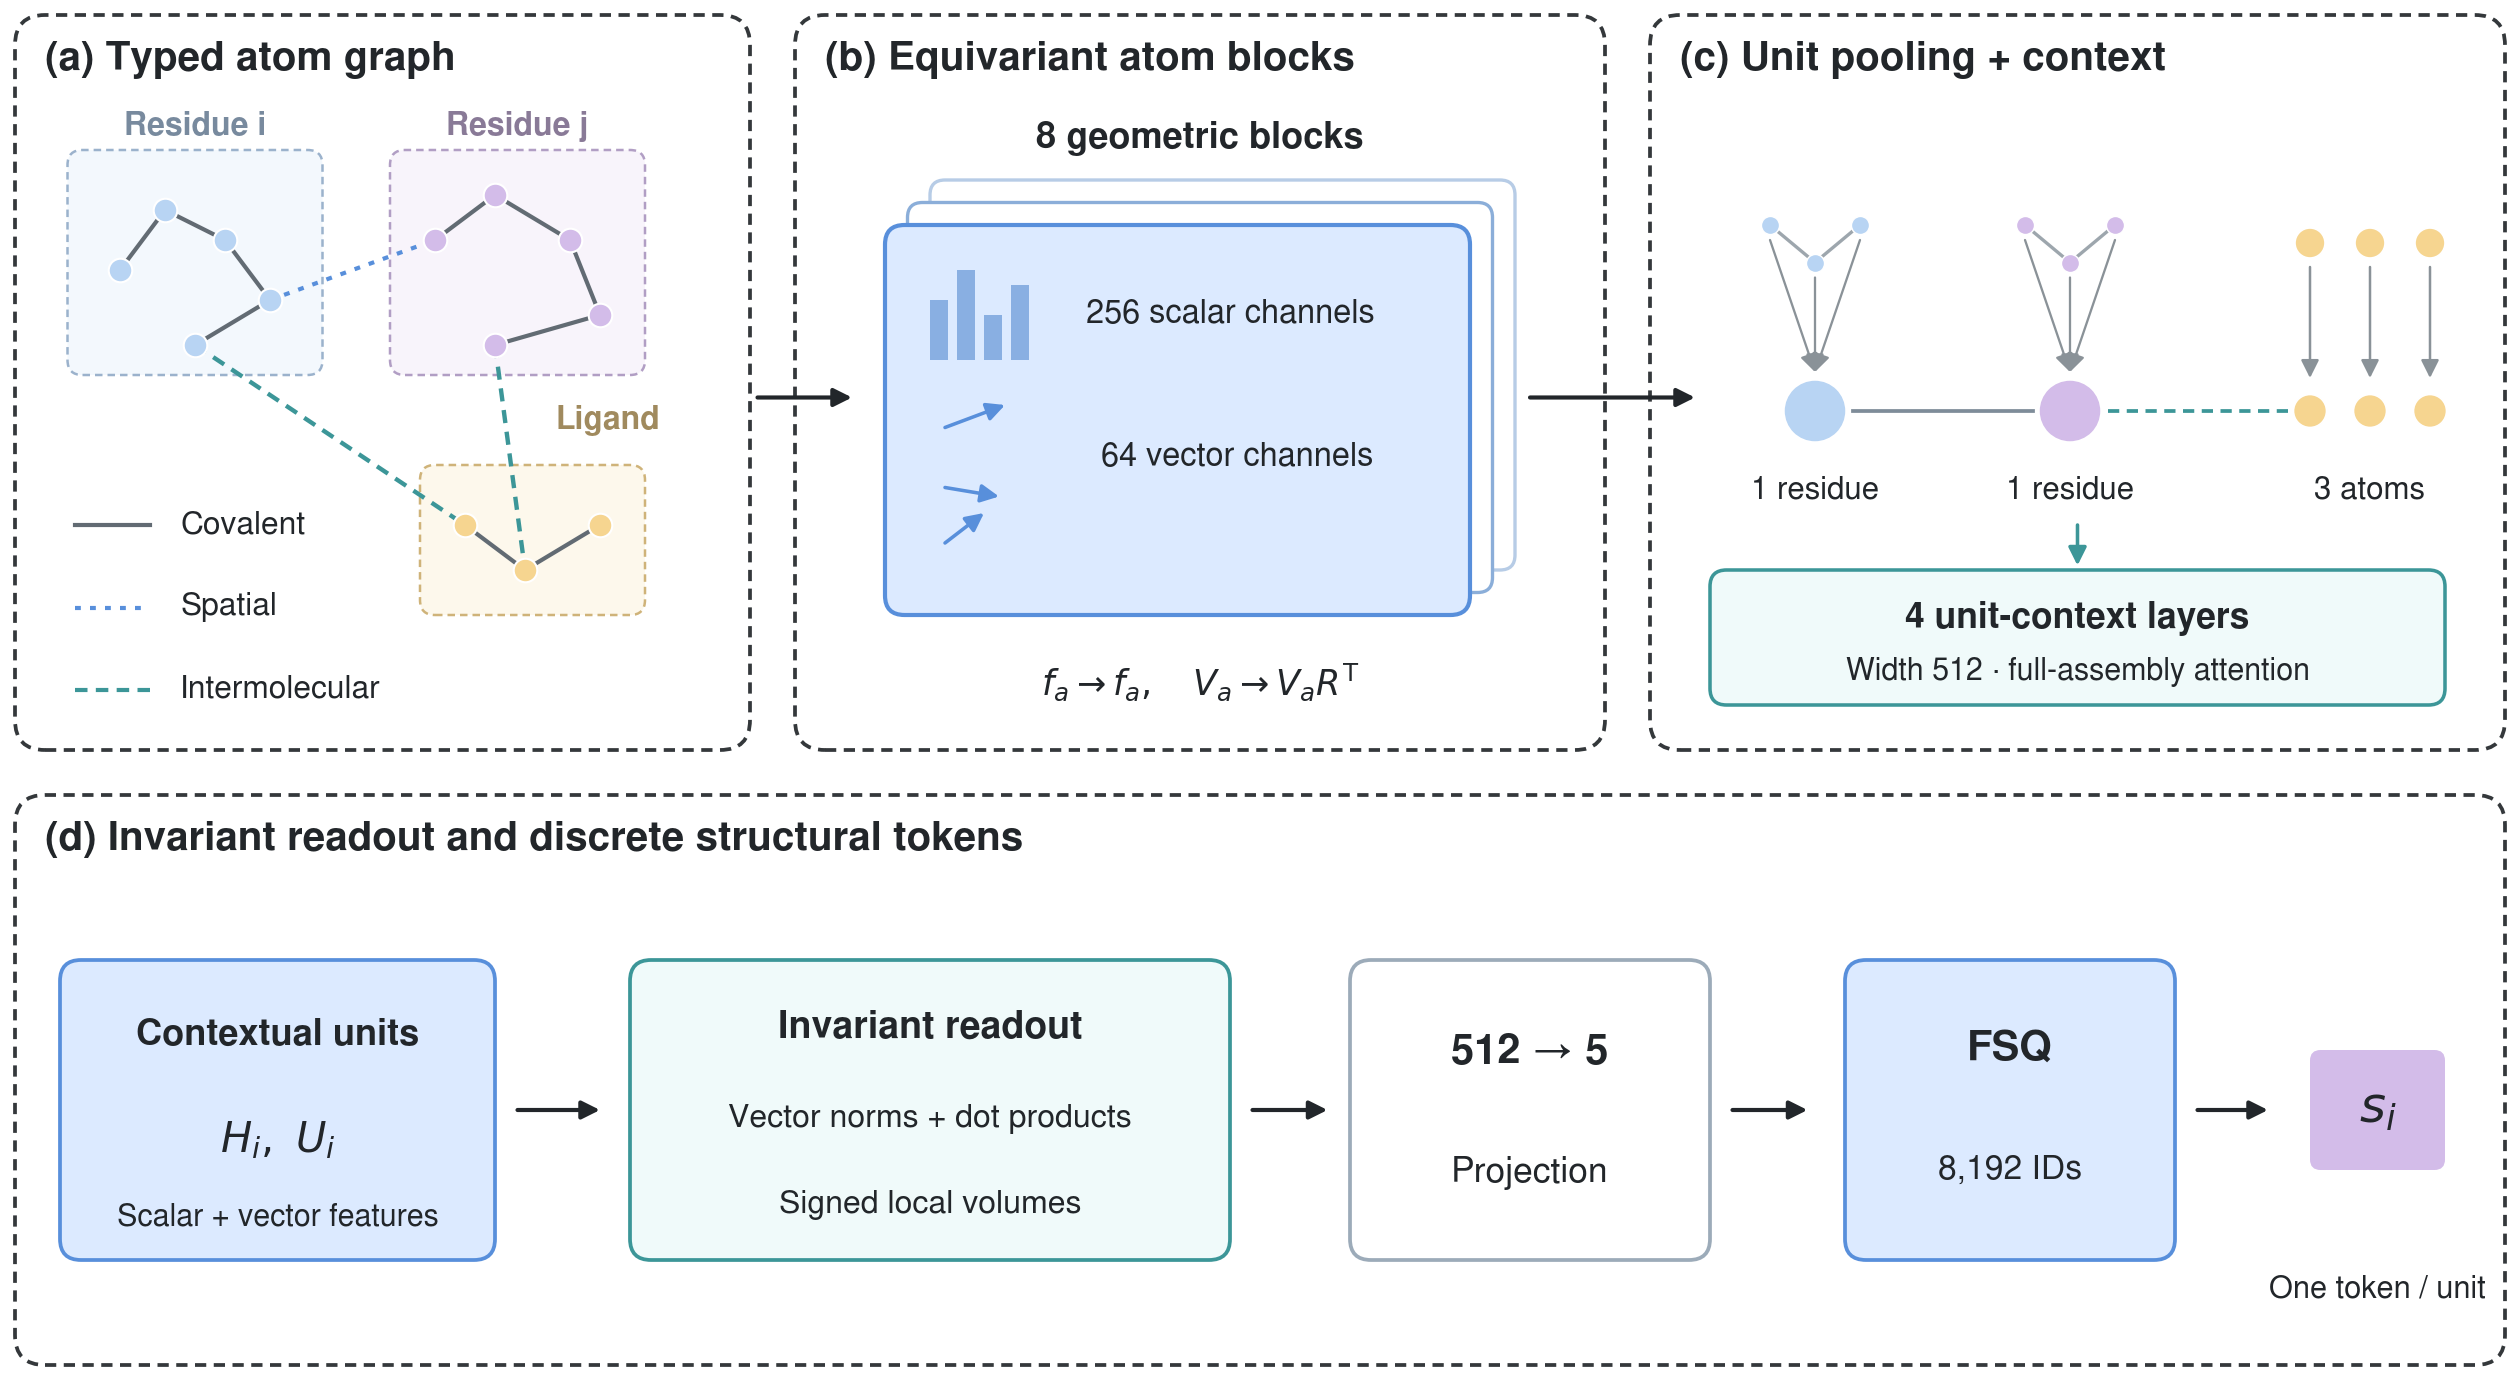
Finite scalar quantization compresses the geometric features of each residue into five values. These have 8, 8, 8, 4, and 4 possible levels, yielding exactly 8,192 distinct identifiers. A protein of 100 residues is represented by 100 such identifiers. For a small-molecule ligand, each heavy atom instead receives its own token, preserving details of the ligand's internal conformation.
02From sequences to three-dimensional structures
First, we test compression: we provide the tokenizer with a known three-dimensional structure, retain the resulting tokens, and ask the decoder to reconstruct coordinates using those identifiers, atomic identities, and chemical bonds. All chains and ligands are decoded together, so it must recover both individual side chains and the relative positions of different molecules.
On CASP14 and CASP15, the reconstructed structures attain all-atom lDDT scores of 0.832 and 0.835, respectively. Higher scores indicate better preservation of distances between atoms and their neighbors. This experiment measures how much geometric information survives when a known structure is converted into tokens.
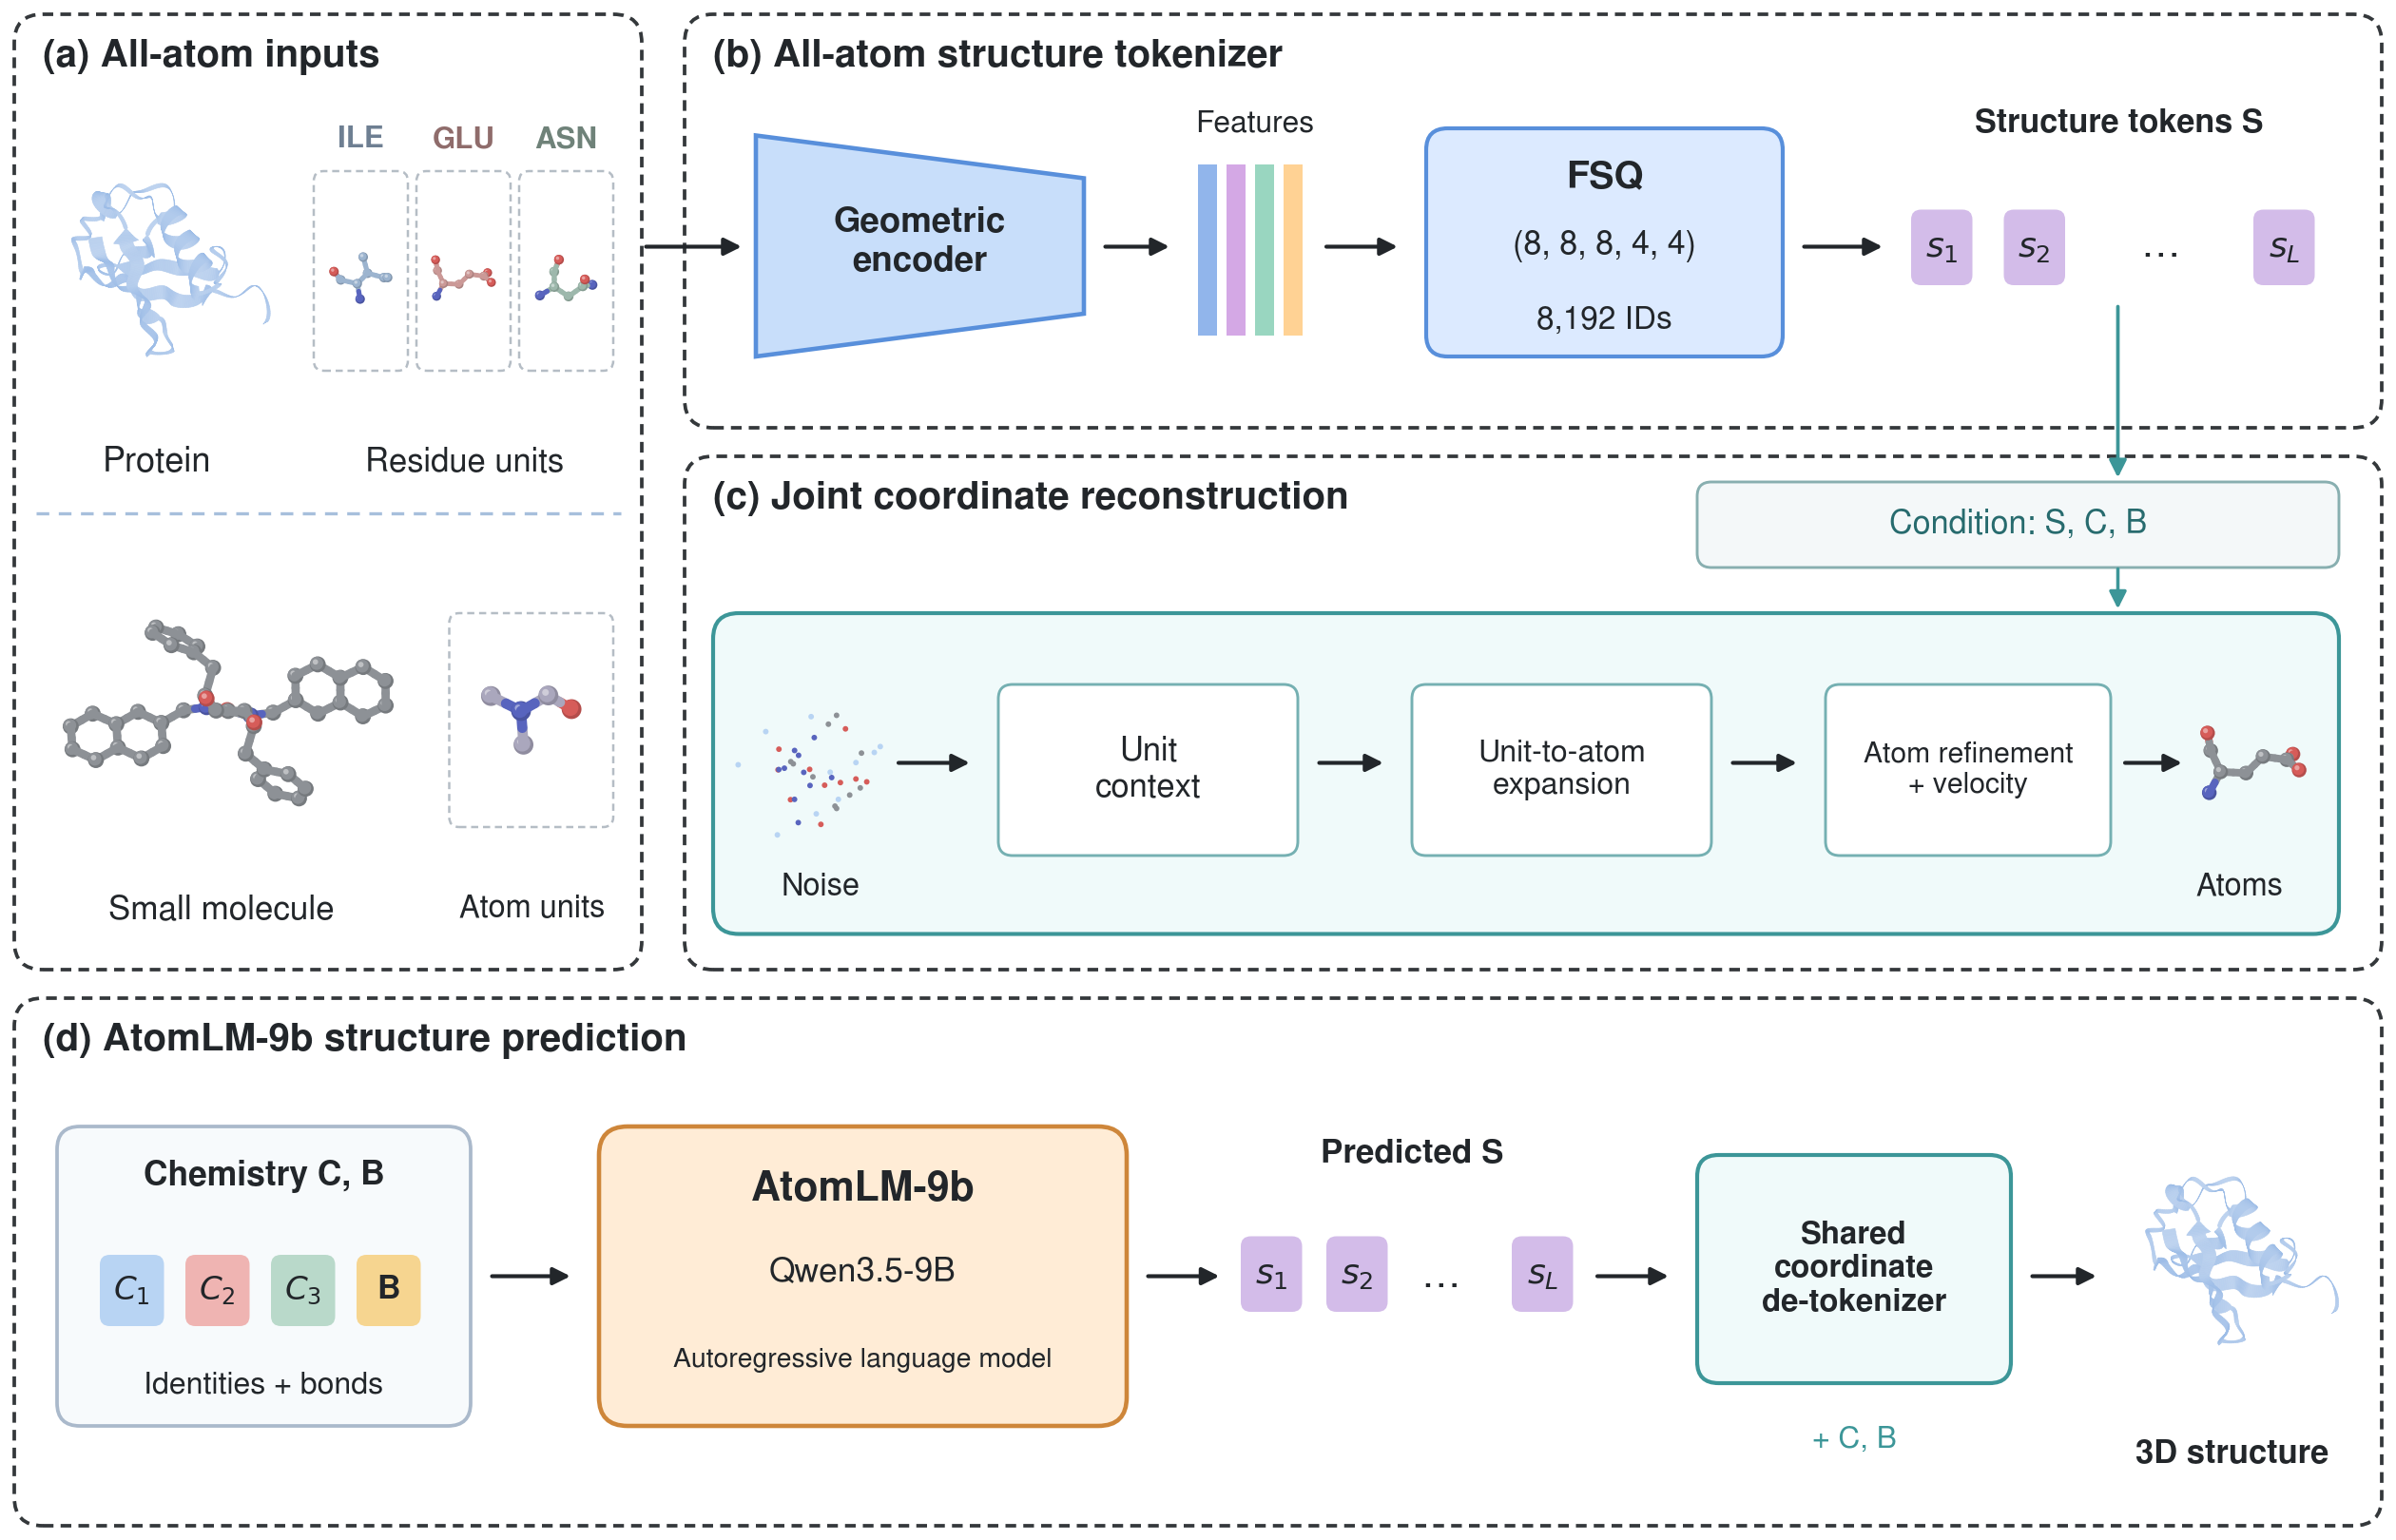
Predicting a new structure adds a harder step: the true coordinates are unavailable, and the model must generate the structural tokens itself. AtomLM-9b reads protein or nucleic-acid sequences, as well as ligand atoms and bonds, then predicts each unit identifier in sequence. The report uses single-sequence, template-free inputs. It samples five sets of tokens and decodes each from five noise initializations, then selects one structure from 25 candidates with a confidence model.
03Which tasks outperformed AF3?
FoldBench measures agreement between a predicted interface and the experimental structure using DockQ. A sample counts as successful when DockQ reaches 0.23. The 75.01% figure is the proportion of samples meeting this threshold. Monomer structures are instead evaluated using mean lDDT.
| FoldBench task and metric | AtomLM-9b | AlphaFold 3 |
|---|---|---|
| Protein monomer · mean lDDT | 0.858 | 0.880 |
| Protein–protein · success rate | 75.01% | 72.93% |
| Protein–ligand · success rate | 67.45% | 64.90% |
| Antibody–antigen · success rate | 44.00% | 47.90% |
AlphaFold 3 figures are from the full evaluation in Supplementary Table 3 of the FoldBench paper. The two models use their respective inference configurations.
Across these four comparisons, AtomLM-9b has higher success rates on protein–protein and protein–ligand tasks, while AF3 performs better on protein monomers and antibody–antigen complexes. Sampling settings also matter: on protein–ligand targets, one candidate gives AtomLM-9b a 62.10% success rate; generating 25 candidates and ranking by confidence raises it to 67.45%, above AF3 published reference result of 64.90%.
PAPER & MODEL